Wyniki CTP NV za I półrocze 2025 r.
Silna aktywność leasingowa w pierwszej połowie 2025 r. z 111 TP5T więcej mkw. podpisanych umów najmu, wzrostem czynszów w porównaniu z cenami porównywalnymi o 4,91 TP5T oraz EPRA NTA na akcję w górę o 13,51 TP5T w skali roku do 19,36 EUR
AMSTERDAM, 7 sierpnia 2025 – CTP NV (CTPNV.AS), („CTP”, „Grupa” lub „Spółka”) odnotowała w I półroczu 2025 r. dochód brutto z najmu w wysokości 367,2 mln euro, co stanowi wzrost o 14,41 TP5T r/r, oraz wzrost czynszów w ujęciu porównywalnym r/r o 4,91 TP5T, głównie dzięki indeksacji i renegocjacjom umów najmu oraz wygasającym. W pierwszej połowie roku utrzymał się wysoki poziom najmu, z 111 TP5T podpisanych umów najmu r/r. Średni miesięczny czynsz z tytułu nowo podpisanych umów najmu wzrósł o 51 TP5T r/r.[1].
Na dzień 30 czerwca 2025 r. roczny dochód z tytułu najmu wzrósł do 757 mln euro, podczas gdy wskaźnik obłożenia pozostał na poziomie 93%, a wskaźnik pobierania czynszu wyniósł 99,7%.
W pierwszej połowie roku CTP oddało do użytku 224 000 mkw. nieruchomości o rentowności kosztowej („YoC”) na poziomie 10,31 TP5T, z 1001 TP5T wynajętymi po zakończeniu budowy, co zwiększyło portfel Grupy do 13,5 mln mkw. GLA. Ponowna wycena porównywalna wyniosła 4,01 TP5T, napędzana wzrostem ERV o 2,51 TP5T, przy średniej kompresji rentowności rewersyjnej o 11 punktów bazowych, podczas gdy wartość aktywów brutto („GAV”) wzrosła o 7,21 TP5T do 17,1 mld euro i 15,91 TP5T rok do roku. Wartość aktywów netto EPRA na akcję wzrosła o 7,11 TP5T w pierwszej połowie roku do 19,36 euro i 13,51 TP5T rok do roku, wspierana również przez postępy w realizacji projektów deweloperskich.
Skorygowany zysk EPRA dla poszczególnych spółek wzrósł o 12,21 TP5T r/r do 199,3 mln euro. Skorygowany zysk na akcję EPRA dla poszczególnych spółek CTP wyniósł 0,42 euro, co stanowi wzrost o 6,21 TP5T. Na wzrost skorygowanego zysku na akcję EPRA dla poszczególnych spółek negatywnie wpłynął wzrost liczby akcji wynikający z podwyższenia kapitału własnego w drugiej połowie 2024 r. Dzięki opóźnionym dostawom i dochodom netto z rozwoju w drugiej połowie roku, Grupa jest na dobrej drodze do osiągnięcia prognozy na poziomie 0,86–0,88 euro na 2025 r., co oznacza wzrost o 8–101 TP5T w porównaniu z 2024 r.
Na dzień 30 czerwca 2025 r. łączna powierzchnia projektów w budowie wynosiła 2,0 mln m kw., a oczekiwana wartość najmu wynosi 10,31 TP5T, a potencjalny dochód z wynajmu po pełnym wynajęciu 160 mln euro.
Bank ziemi Grupy wynosił 26,1 mln m², z czego 22,2 mln m² jest własnością i znajduje się w bilansie. Ten bank ziemi zapewnia CTP znaczny potencjał wzrostu w przyszłości, z 901 TP5T zlokalizowanymi wokół istniejących parków biznesowych (581 TP5T w istniejących parkach, 311 TP5T w nowych parkach o potencjale ponad 100 000 GLA). W połączeniu z wiodącą w branży liczbą powierzchni komercyjnych (YoC), CTP spodziewa się dalszego dwucyfrowego wzrostu NTA w nadchodzących latach.
Szczególnie korzystamy z trendu nearshoringu, o czym świadczy nasz rozwój we współpracy z azjatyckimi najemcami z branży produkcyjnej, którzy odpowiadali za około 201 TP5T naszej ogólnej aktywności najmu w ciągu ostatnich 18 miesięcy, w porównaniu do ponad 101 TP5T udziału w naszym całym portfelu.
Roczny dochód z najmu wzrósł do 757 mln euro. Kolejny etap rozwoju jest już zapewniony dzięki 2 mln m² powierzchni najmu brutto w budowie i 26,1 mln m² gruntów w banku, co oznacza, że w nadchodzących latach możemy kontynuować dwucyfrowy wzrost NTA. Jesteśmy przekonani, że uda nam się osiągnąć nasze ambitne cele i osiągnąć 1 mld euro rocznego dochodu z najmu w 2027 roku.
Najważniejsze informacje
| W mln € | H1-2025 | I półrocze 2024 | Zmiana % |
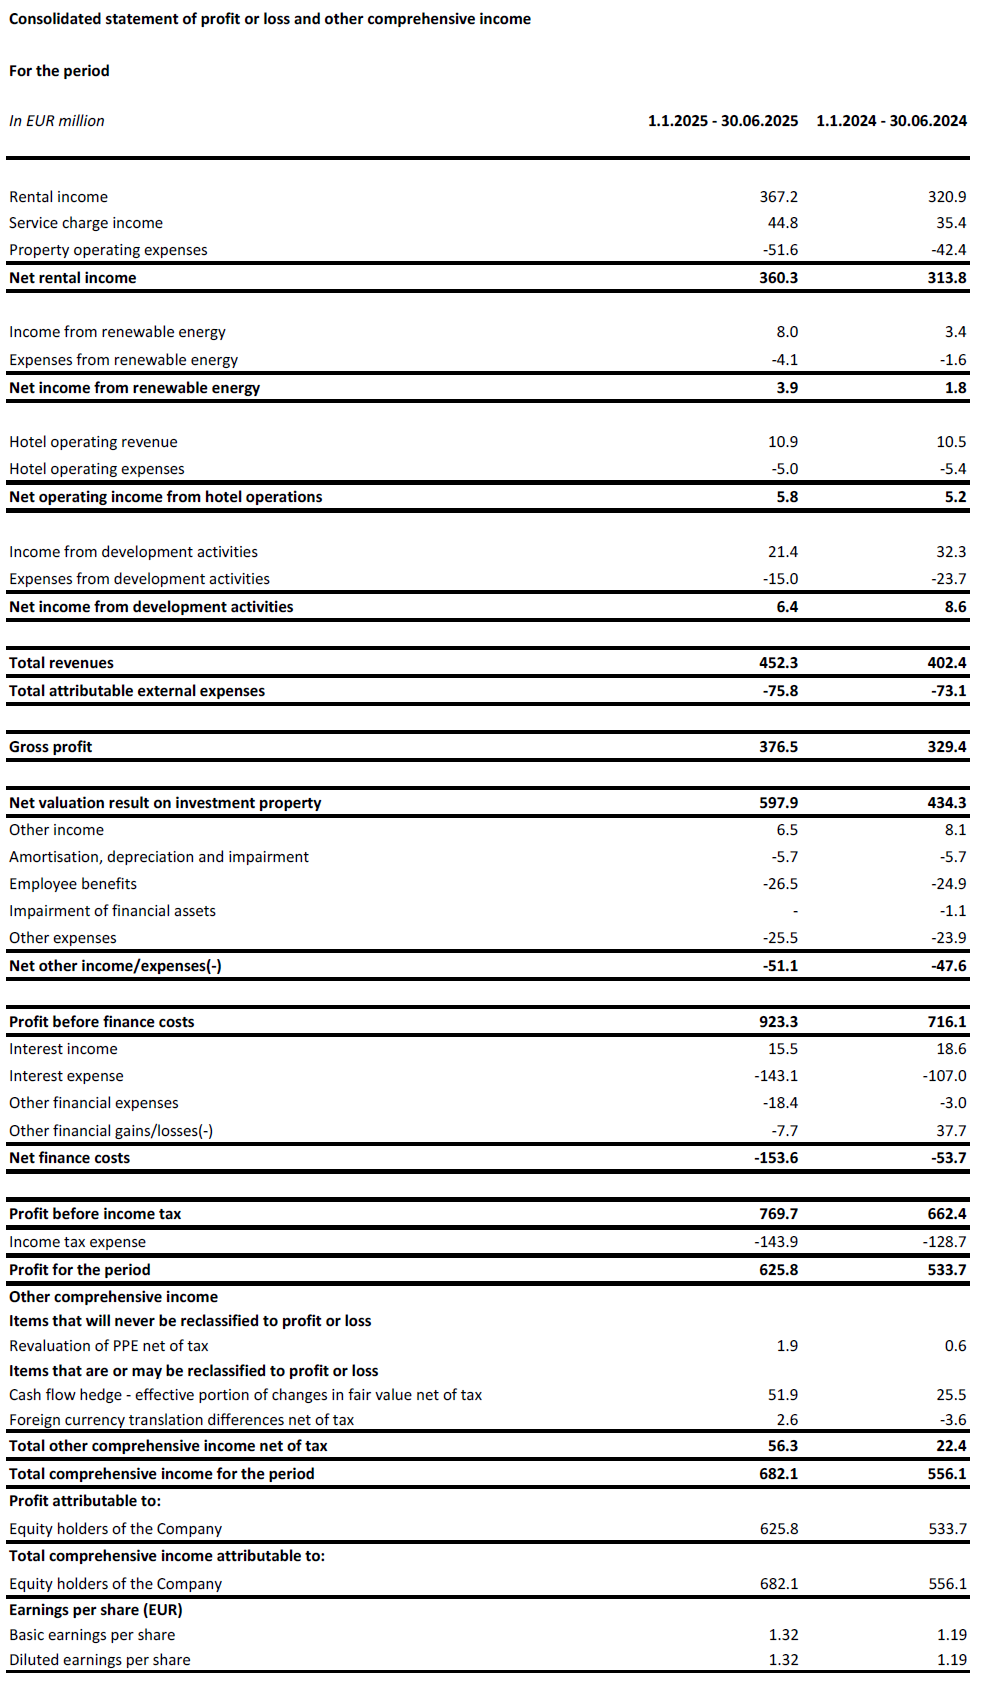
| Dochód z wynajmu brutto | 367.2 | 320.9 | +14.4% |
| Dochód netto z wynajmu | 360.3 | 313.8 | +14.8% |
| Wynik netto z wyceny nieruchomości inwestycyjnych | 597.9 | 434.3 | +37.7% |
| Zysk za okres | 625.8 | 533.7 | +17.2% |
| Skorygowany zysk EPRA dla poszczególnych spółek | 199.3 | 177.6 | +12.2% |
| W € | H1-2025 | I półrocze 2024 | Zmiana % |
| Skorygowany wskaźnik EPRA EPS dla poszczególnych spółek | 0.42 | 0.40 | +6.2% |
| W mln € | 30 czerwca 2025 r. | 31 grudnia 2024 r. | Zmiana % |
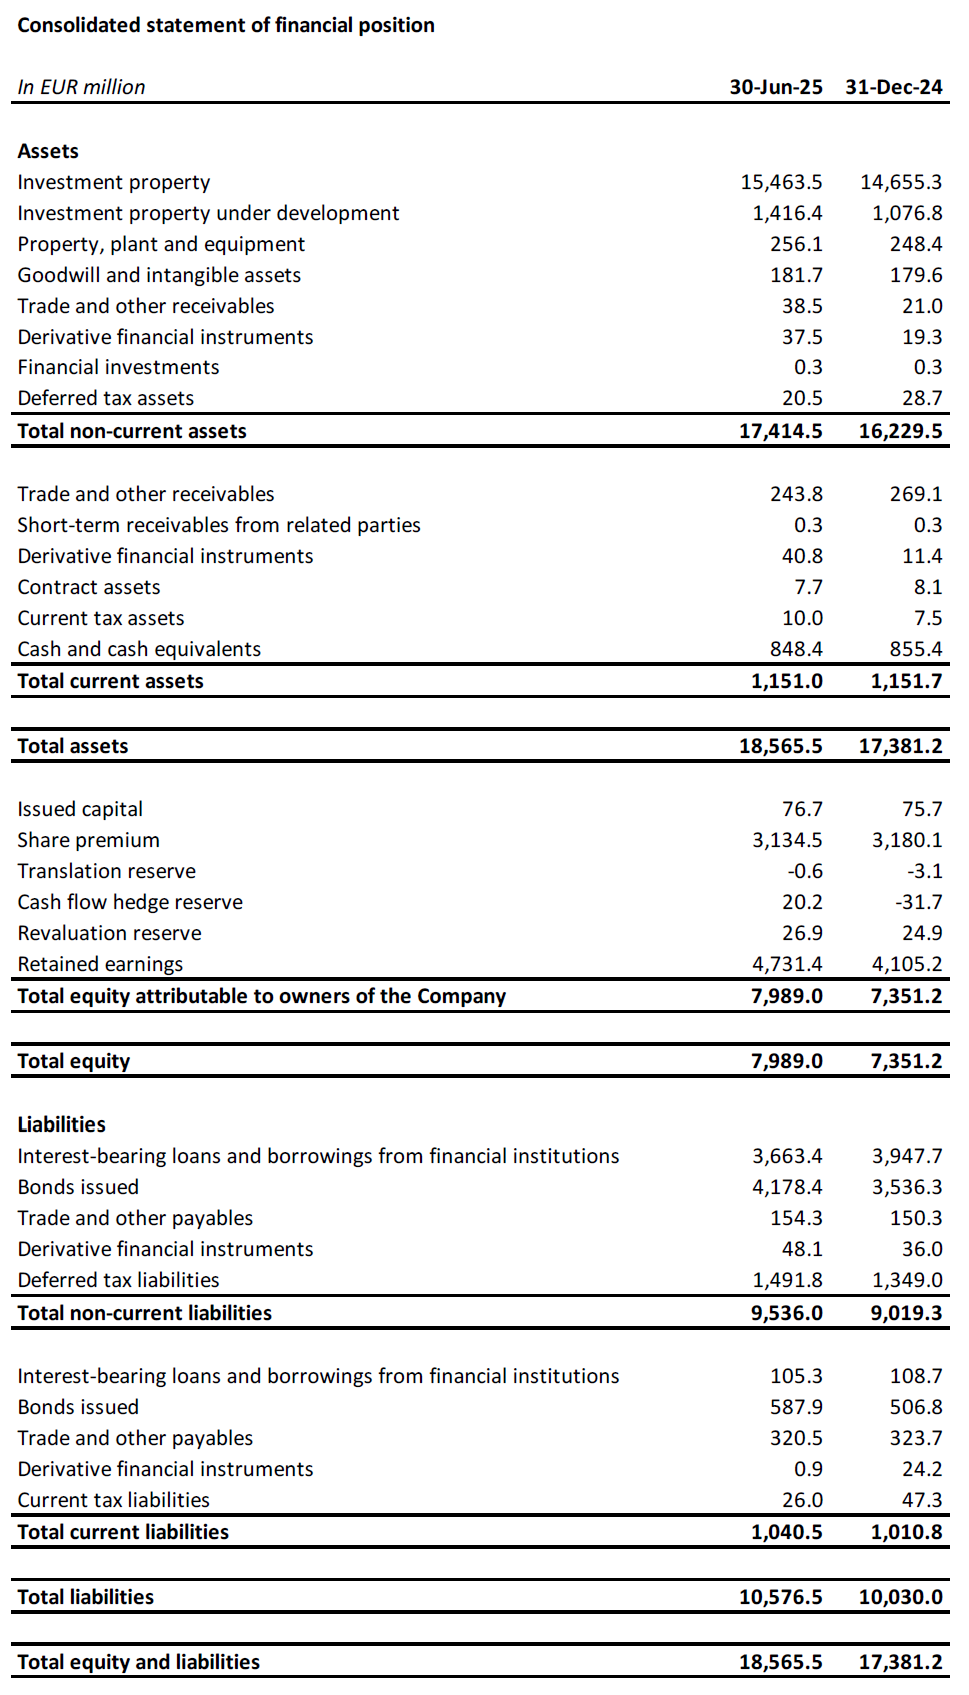
| Nieruchomości inwestycyjne ("IP") | 15,463.5 | 14,655.3 | +5.5% |
| Nieruchomość inwestycyjna w trakcie realizacji ("IPuD") | 1,416.4 | 1,076.8 | +31.5% |
| 30 czerwca 2025 r. | 31 grudnia 2024 r. | Zmiana % | |
| EPRA NTA na akcję | €19.36 | €18.08 | +7.1% |
| Oczekiwany YoC projektów w budowie | 10.3% | 10.3% | |
| LTV | 44.9% | 45.3% |
Utrzymujący się duży popyt ze strony najemców napędza wzrost czynszów
W pierwszej połowie 2025 roku CTP podpisało umowy najmu na 1 015 000 m², co stanowi wzrost o 111 TP5T w porównaniu z analogicznym okresem 2024 roku, przy średnim miesięcznym czynszu za m² wynoszącym 5,98 euro (I połowa 2024 roku: 5,59 euro). Po uwzględnieniu różnic w strukturze rynku, czynsze wzrosły średnio o 51 TP5T.
| Podpisane umowy najmu wg mkw. | Q1 | Q2 | NARASTAJĄCO | Q3 | Pytanie 4 | FY |
| 2023 | 297,000 | 552,000 | 849,000 | 585,000 | 542,000 | 1,976,000 |
| 2024 | 336,000 | 582,000 | 919,000 | 577,000 | 618,000 | 2,113,000 |
| 2025 | 416,000 | 599,000 | 1,015,000 | |||
| Wzrost rok do roku | +24% | +3% | +11% |
| Średni miesięczny czynsz podpisanych umów najmu na m2 (€) | Q1 | Q2 | NARASTAJĄCO | Q3 | Pytanie 4 | FY |
| 2023 | 5.31 | 5.56 | 5.47 | 5.77 | 5.81 | 5.69 |
| 2024 | 5.65 | 5.55 | 5.59 | 5.69 | 5.79 | 5.68 |
| 2025 | 6.17 | 5.91 | 5.98 |
Około dwóch trzecich podpisanych umów najmu zostało zawartych z obecnymi najemcami, co jest zgodne z modelem biznesowym CTP, który opiera się na rozwijaniu działalności wraz z obecnymi najemcami w istniejących parkach.
Generowanie przepływów pieniężnych poprzez stały portfel i przejęcia
Średni udział CTP w rynku czeskim, rumuńskim, węgierskim i słowackim na dzień 30 czerwca 2025 r. wyniósł 28,21 TP5T, a spółka pozostaje największym właścicielem i deweloperem aktywów przemysłowych i logistycznych na tych rynkach. Grupa jest również liderem rynku w Serbii i Bułgarii.
Z ponad 1500 klientami, CTP posiada szeroką i zdywersyfikowaną międzynarodową bazę najemców, składającą się z firm o wysokiej renomie i wysokich ratingach kredytowych. Najemcy CTP reprezentują szeroki wachlarz branż, w tym produkcję, high-tech/IT, motoryzację, e-commerce, handel detaliczny, hurtowy i firmy 3PL. Baza najemców jest bardzo zdywersyfikowana – żaden z nich nie odpowiada za więcej niż 2,51 TP5T rocznego czynszu firmy, co zapewnia stabilny strumień dochodów. Na 50 największych najemców CTP przypada zaledwie 36,01 TP5T czynszu, a zdecydowana większość klientów wynajmuje powierzchnie w wielu parkach CTP.
Zajętość powierzchni biurowej Spółki wyniosła 931 TP5T (rok obrotowy 2024: 93%). Wskaźnik utrzymania klientów Grupy utrzymuje się na wysokim poziomie 851 TP5T (rok obrotowy 2024: 87%), co świadczy o zdolności CTP do budowania długotrwałych relacji z klientami. Średnia oczekiwana wartość ważonego wygaśnięcia portfela (WAULT) wyniosła 6,2 roku (rok obrotowy 2024: 6,4 roku), co jest zgodne z celem Spółki wynoszącym >6 lat.
W pierwszym półroczu 2025 r. czynsze pobierane z tytułu czynszów wyniosły 99,71 TP5T (rok fiskalny 2024: 99,81 TP5T), przy czym nie odnotowano pogorszenia w profilu płatności najemców.
Przychody z najmu w pierwszej połowie 2025 r. wyniosły 367,2 mln euro, co oznacza wzrost o 14,41 TP5T rok do roku w ujęciu bezwzględnym, głównie dzięki dostawom i wzrostowi w ujęciu porównywalnym. W ujęciu porównywalnym przychody z najmu wzrosły o 4,91 TP5T dzięki indeksacji i renegocjacji z tytułu renegocjacji i wygasających umów najmu.
Grupa wdrożyła środki mające na celu ograniczenie wycieku opłat za usługi, co doprowadziło do poprawy wskaźnika dochodu netto z wynajmu do dochodu z wynajmu z 97,81 TP5T w I półroczu 2024 r. do 98,11 TP5T w I półroczu 2025 r. W rezultacie dochód netto z wynajmu wzrósł o 14,81 TP5T rok do roku.
Coraz większa część dochodów z wynajmu generowanych przez portfel inwestycyjny CTP korzysta z ochrony przed inflacją. Od końca 2019 r. wszystkie nowe umowy najmu Grupy obejmują klauzulę indeksacji powiązaną z CPI, która oblicza roczne podwyżki czynszu jako wyższą z następujących wartości:
- stały wzrost o 1,5%-2,5% rocznie; lub
- wskaźnik cen towarów i usług konsumpcyjnych[2].
Na dzień 30 czerwca 2025 r. 72% przychodów generowanych przez portfel Grupy obejmuje klauzulę podwójnej indeksacji, a Grupa przewiduje, że ta wartość będzie nadal wzrastać.
Potencjał rewersyjny wyniósł 14,91 TP5T. Nowe umowy najmu są podpisywane stale powyżej szacowanej wartości czynszu. („ERV”), co obrazuje utrzymujący się silny wzrost czynszów na rynku i wspierające wyceny.
Zroczysta kwota dochodu z wynajmu na dzień 30 czerwca 2025 r. wyniosła 757 mln euro, co oznacza wzrost o 11,51 TP5T w ujęciu rok do roku i świadczy o silnym wzroście przepływów pieniężnych w portfelu inwestycyjnym CTP.
Inwestycje z pierwszego półrocza zrealizowane z 10,3% YoC i 100% dzierżawionych w momencie dostawy
CTP kontynuowała zdyscyplinowane inwestycje w swój wysoce rentowny rurociąg.
W pierwszej połowie 2025 roku Grupa ukończyła budowę 224 000 m² GLA (w pierwszej połowie 2024 roku: 328 000 m²). Inwestycje zostały oddane do użytku przy średniej wartości najmu 10,31 TP5T, a ich wartość najmu wyniesie 1001 TP5T, co wygeneruje roczny dochód z wynajmu w wysokości 12,1 mln euro. Jak zwykle, dostawy w 2025 roku są przesunięte w kierunku czwartego kwartału.
Podczas gdy średnie koszty budowy w 2022 roku wynosiły około 550 euro za m², w latach 2023 i 2024 osiągnęły poziom 500 euro za m² i pozostały stabilne w pierwszej połowie 2025 roku. Pozwala to Grupie na dalsze osiąganie wiodącego w branży wskaźnika YoC przekraczającego 1015 ton (TP5T), co jest również wspierane przez unikalny model parku oraz wewnętrzne doświadczenie CTP w zakresie budowy i zaopatrzenia.
Na dzień 30 czerwca 2025 r. Grupa miała w budowie 2,0 mln m² budynków z potencjalnym dochodem z wynajmu w wysokości 160 mln euro i oczekiwaną wartością końcową (YoC) wynoszącą 10,31 TP5T. CTP ma długą historię generowania zrównoważonego wzrostu poprzez inwestycje realizowane z udziałem najemców w istniejących parkach. 791 TP5T projektów Grupy w budowie znajduje się w istniejących parkach, a 91 TP5T w nowych parkach, które mają potencjał rozbudowy do ponad 100 000 m² GLA. Planowane dostawy na 2025 r. to 531 TP5T przednajmowanych obiektów, w porównaniu z 351 TP5T w roku obrotowym 2024. Przednajmowane obiekty w istniejących parkach wyniosły 471 TP5T, a w nowych parkach 801 TP5T, co świadczy o niskim ryzyku związanym z planowanymi inwestycjami. CTP spodziewa się osiągnąć poziom 80%-90% w momencie przekazania budynków, co jest zgodne z wynikami historycznymi. Ponieważ CTP działa jako generalny wykonawca na większości rynków, ma pełną kontrolę nad procesem i terminami dostaw, co pozwala Spółce na przyspieszenie lub spowolnienie prac w zależności od popytu najemców, a jednocześnie oferuje najemcom elastyczność w zakresie wymagań dotyczących budynku.
W 2025 roku Grupa planuje dostarczyć od 1,2 do 1,7 mln m² powierzchni, w zależności od popytu najemców. 106 000 m² umów najmu, które zostały już podpisane w ramach przyszłych projektów – których budowa jeszcze się nie rozpoczęła – stanowi kolejny dowód na utrzymujący się popyt ze strony najemców.
Bank ziemi CTP na dzień 30 czerwca 2025 r. wynosił 26,1 mln m² (31 grudnia 2024 r.: 26,4 mln m²), co pozwala Spółce osiągnąć cel 20 mln m² GLA do końca dekady. Grupa koncentruje się na mobilizacji istniejącego banku ziemi, jednocześnie utrzymując dyscyplinę alokacji kapitału w celu jego uzupełniania. 58% z banku ziemi znajduje się w istniejących parkach CTP, a 31% znajduje się w nowych parkach lub w ich sąsiedztwie, które mają potencjał do wzrostu do ponad 100 000 m². 15% z banku ziemi zostało zabezpieczone opcjami, a pozostałe 85% było własnością Spółki i odpowiednio ujęte w bilansie.
Zakładając wskaźnik zabudowy 2 m² gruntu na 1 m² GLA, CTP może wybudować ponad 13 milionów m² GLA na zabezpieczonym banku ziemi. Grunty CTP są wyceniane w bilansie na około 60 euro za m², a koszty budowy wynoszą średnio około 500 euro za m², co daje całkowity koszt inwestycji około 620 euro za m². Wartość gotowego portfela Grupy wynosi około 1040 euro za m², co daje potencjał przeszacowania na poziomie około 400 euro za wybudowany m².
Monetyzacja biznesu energetycznego
CTP kontynuuje swój plan rozwoju w zakresie wdrażania systemów fotowoltaicznych. Przy średnim koszcie wynoszącym ~750 000 EUR na MWp, Grupa planuje osiągnąć w przypadku tych inwestycji wskaźnik YoC na poziomie 151 TP3T.
CTP dysponuje zainstalowaną mocą fotowoltaiczną wynoszącą 138 MWp, z czego 108 MWp jest w pełni operacyjne.
WI półroczu 2025 r. przychody z energii odnawialnej wyniosły 8,0 mln euro, co oznacza wzrost o 1361 TP5T w ujęciu rok do roku, głównie na skutek wzrostu mocy zainstalowanej w całym 2024 r.
Ambicje CTP w zakresie zrównoważonego rozwoju idą w parze z coraz większą liczbą najemców oczekujących systemów fotowoltaicznych, ponieważ zapewniają im one i) większe bezpieczeństwo energetyczne, ii) niższe koszty użytkowania, iii) zgodność z zaostrzonymi przepisami, iv) zgodność z wymaganiami klientów oraz v) możliwość realizacji własnych ambicji ESG.
Wyniki wyceny napędzane przez pipeline i pozytywną ponowną wycenę portfela stałego
Wartość nieruchomości inwestycyjnych („IP”) wzrosła z 14,7 mld euro na dzień 31 grudnia 2024 r. do 15,5 mld euro na dzień 30 czerwca 2025 r., co było spowodowane przeniesieniem ukończonych projektów z Nieruchomości inwestycyjnych w fazie rozwoju („IPuD”) do IP oraz pozytywną wyceną istniejącego portfela.
Wartość IPuD wzrosła o 31,51 TP5T od 31 grudnia 2024 r. do 1,4 mld euro na dzień 30 czerwca 2025 r., co było spowodowane wydatkami inwestycyjnymi, ponowną wyceną wynikającą ze wzrostu liczby wynajmowanych lokali i postępu prac budowlanych oraz rozpoczęciem nowych projektów budowlanych w pierwszej połowie 2025 r.
Wartość GAV wzrosła do 17,1 mld euro na dzień 30 czerwca 2025 r., co stanowi wzrost o 7,21 TP5T w porównaniu do dnia 31 grudnia 2024 r.
Ponowna wycena w pierwszej połowie 2025 r. wyniosła 597,9 mln euro i była spowodowana dodatnią wyceną projektów IPuD (+181,3 mln euro), banku ziemi (+43,1 mln euro) i aktywów trwałych (+373,6 mln euro).
W ujęciu porównywalnym wycena portfela CTP wzrosła o 4,0% w pierwszej połowie 2025 r., co było spowodowane wzrostem wartości ERV o 2,5%.
CTP spodziewa się dalszego pozytywnego wzrostu ERV na skutek nieustającego popytu najemców, na który pozytywnie wpływają sekularne czynniki wzrostu w regionie CEE. Poziomy czynszów w CEE pozostają przystępne; pomimo silnego wzrostu, który zaobserwowano, ponieważ zaczynały się od znacznie niższych poziomów bezwzględnych niż w krajach Europy Zachodniej. W ujęciu realnym czynsze na wielu rynkach CEE nadal są niższe niż poziomy z 2010 r.
Portfel Grupy charakteryzuje się konserwatywną wyceną stóp zwrotu na poziomie 7,0%. W pierwszej połowie 2025 r. CTP odnotował dalszą kompresję stóp zwrotu o średnio 11 punktów bazowych w całym portfelu i oczekuje się dalszej kompresji stóp zwrotu w drugiej połowie 2025 r. Oczekuje się, że różnica stóp zwrotu między logistyką w Europie Środkowo-Wschodniej a logistyką w Europie Zachodniej będzie się zmniejszać z czasem, co wynika z wyższych oczekiwań wzrostu w regionie Europy Środkowo-Wschodniej oraz rosnącej aktywności na rynkach inwestycyjnych.
Wskaźnik EPRA NTA na akcję wzrósł z 18,08 EUR na dzień 31 grudnia 2024 r. do 19,36 EUR na dzień 30 czerwca 2025 r., co stanowi wzrost rok do roku o 13,51 TP5T i wzrost o 7,11 TP5T w pierwszej połowie 2025 r. Wzrost ten wynika głównie z ponownej wyceny (+1,25 EUR), skorygowanego zysku na akcję EPRA dla poszczególnych spółek (+0,42 EUR) oraz skompensowany ostateczną dywidendą za 2024 r. wypłaconą w maju (-0,30 EUR) i innymi pozycjami (-0,09 EUR).
Solidny bilans i silna pozycja płynnościowa
Zgodnie ze swoim proaktywnym i ostrożnym podejściem, Grupa korzysta z solidnej pozycji płynnościowej, aby sfinansować swoje ambicje wzrostu, przy stałym koszcie zadłużenia i konserwatywnym profilu spłaty.
W pierwszym półroczu 2025 r. Grupa pozyskała 1,7 mld euro na sfinansowanie swojego wzrostu organicznego:
- Zielona obligacja dwutranszowa o wartości 1,0 mld euro z sześcioletnią transzą o wartości 500 mln euro przy stopie oprocentowania MS +145 punktów bazowych i kuponie 3,625% oraz dziesięcioletnią transzą o wartości 500 mln euro przy stopie oprocentowania MS +188 punktów bazowych i kuponie 4,25%;
- Pięcioletnia niezabezpieczona linia pożyczkowa w wysokości 30 mld JPY (równowartość 185 mln EUR) z konsorcjum banków azjatyckich przy stopie TONAR +130 punktów bazowych i stałym całkowitym koszcie w wysokości 4,1%; oraz
- Pięcioletnia niezabezpieczona linia pożyczkowa powiązana ze zrównoważonym rozwojem, o wartości 500 mln euro, udzielona przez konsorcjum 13 banków europejskich i azjatyckich, po stałej cenie całkowitej 3,7%, niewykorzystana na dzień 30 czerwca 2025 r.
CTP kontynuowało aktywne zarządzanie swoim portfelem kredytów bankowych w pierwszej połowie 2025 roku. Wynegocjowano redukcję marży na kolejnych 159 mln euro zabezpieczonych kredytów bankowych, a 441 mln euro niezabezpieczonego kredytu terminowego podpisanego w 2023 roku zostało przedpłacone i zostanie zrefinansowane nowym niezabezpieczonym kredytem w wysokości 500 mln euro. Oba te działania pozwoliły CTP osiągnąć istotne oszczędności na stopach procentowych i obniżyć całkowity koszt zadłużenia w przyszłości.
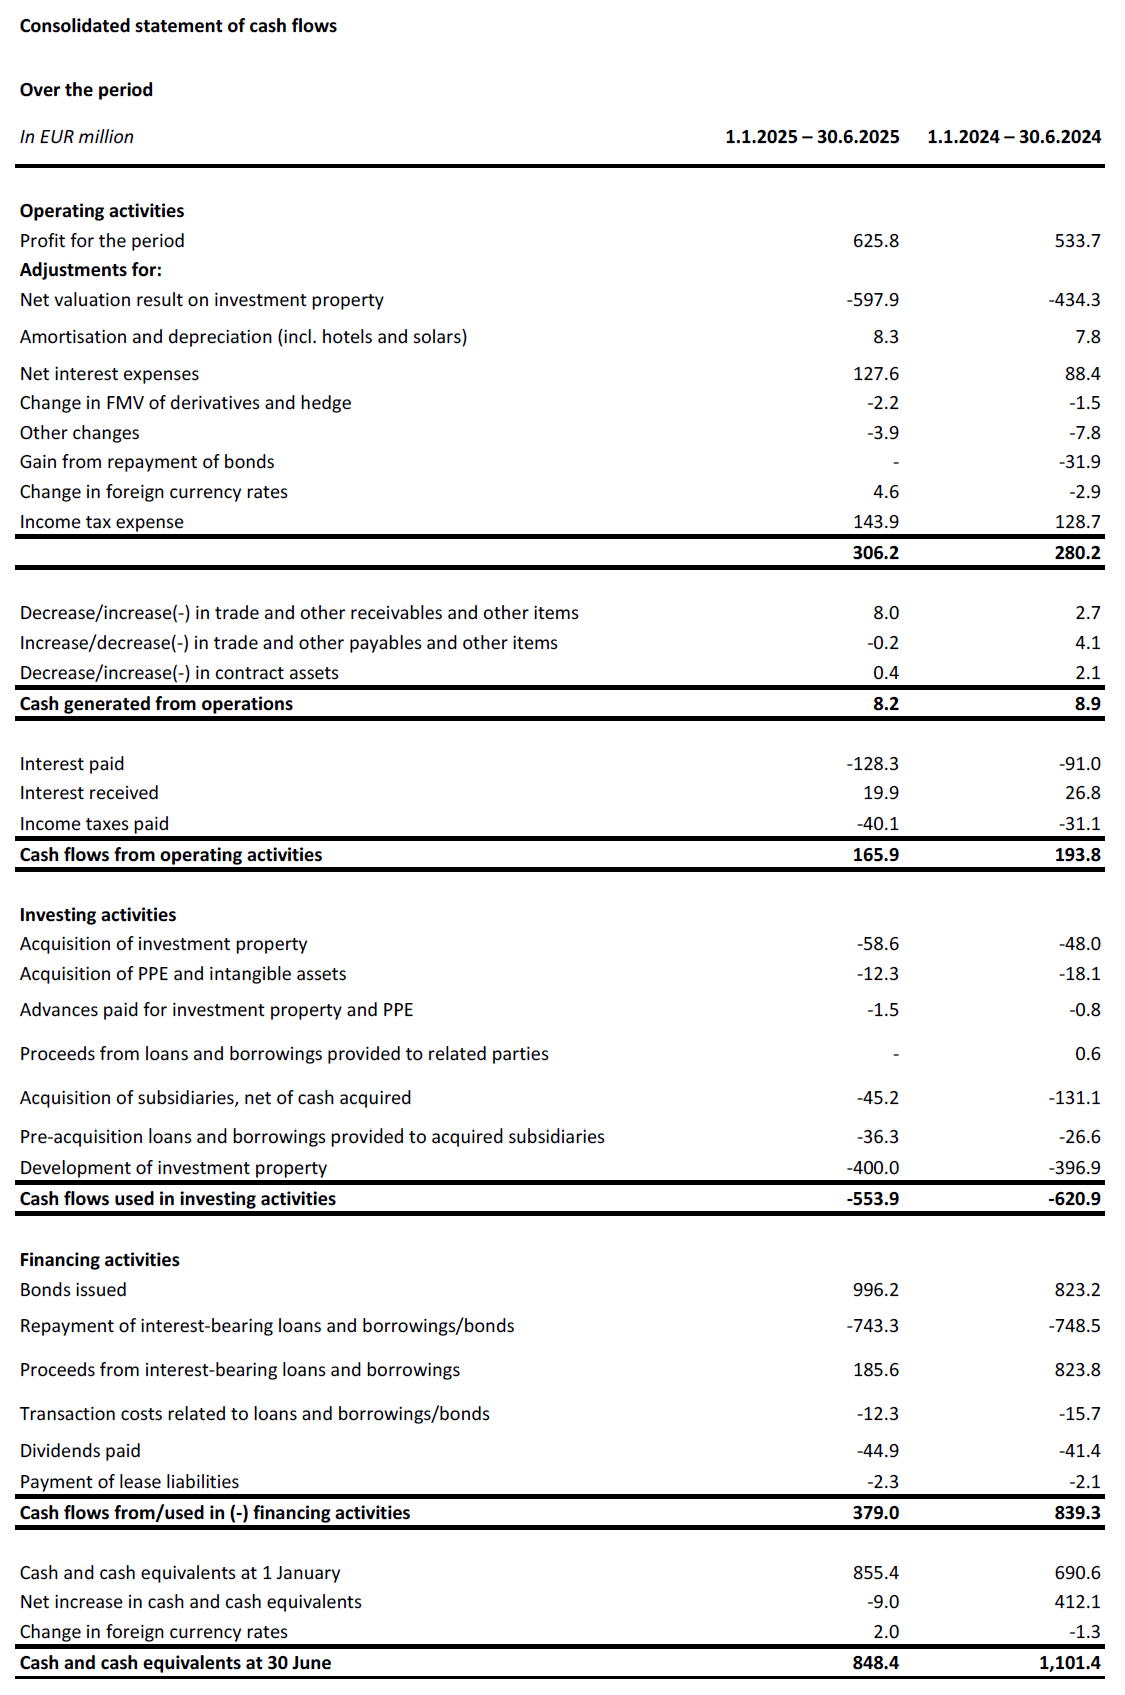
Płynność finansowa Grupy wyniosła 2,1 mld euro, na co składało się 0,8 mld euro gotówki i jej ekwiwalentów oraz niewykorzystany kapitał RCF w wysokości 1,3 mld euro.
Średni koszt zadłużenia CTP wyniósł 3,2% (rok fiskalny 2024: 3,1%), co stanowi niewielki wzrost w porównaniu z końcem 2024 r., ze względu na nowe finansowanie. 99,9% zadłużenia jest oprocentowane na stałe lub zabezpieczone do momentu zapadalności.
Grupa nie kapitalizuje odsetek od inwestycji, dlatego wszystkie koszty odsetkowe są uwzględniane w rachunku zysków i strat. Średnia zapadalność długu wyniosła 5,1 roku (FY-2024: 5,0 lat).
Grupa spłaciła obligacje o wartości 272 mln euro w czerwcu 2025 roku z dostępnych środków pieniężnych. Następnym terminem wykupu jest obligacja o wartości 185 mln euro z terminem wykupu w październiku 2025 roku, która również zostanie spłacona z dostępnych rezerw gotówkowych.
Wskaźnik LTV spółki CTP spadł do 44,9% na dzień 30 czerwca 2025 r., głównie ze względu na pozytywną wycenę istniejącego portfela oraz nieruchomości inwestycyjnych w trakcie realizacji.
Aktywa Grupy o wyższej rentowności, dzięki rentowności brutto portfela wynoszącej 6,61 TP5T, przekładają się na zdrowy poziom dźwigni finansowej w przepływach pieniężnych, co znajduje odzwierciedlenie również w znormalizowanym wskaźniku zadłużenia netto do EBITDA wynoszącym 9,2x (rok obrotowy 2024: 9,1x), który Grupa planuje utrzymać poniżej 10x.
Na dzień 30 czerwca 2025 r. Grupa miała 66% niezabezpieczonego długu i 34% zabezpieczonego długu, przy czym istniała znaczna rezerwa w ramach Testu Zabezpieczonego Długu i Testu Nieobciążonych Aktywów.
W miarę racjonalizacji cen na rynku obligacji warunki stały się bardziej konkurencyjne niż ceny na rynku kredytów bankowych, co pozwoli Grupie na większe przestawienie się na kredytowanie niezabezpieczone.
| 30 czerwca 2025 r. | Przymierze | |
| Test długu zabezpieczonego | 15.7% | 40% |
| Test aktywów wolnych od obciążeń | 194.9% | 125% |
| Wskaźnik pokrycia odsetek | 2,4x | 1.5x |
W III kw. 2024 r. agencja S&P potwierdziła rating kredytowy CTP na poziomie BBB- z perspektywą stabilną. W styczniu 2025 r. japońska agencja ratingowa JCR nadała CTP rating kredytowy na poziomie A- z perspektywą stabilną. W II kw. 2025 r. agencja Moody's podniosła perspektywę ratingu kredytowego Baa3 ze stabilnej na pozytywną.
Przewodnictwo
Dynamika najmu utrzymuje się na wysokim poziomie, przy silnym popycie ze strony najemców i malejącej podaży nowej powierzchni, co prowadzi do dalszego wzrostu czynszów. CTP jest dobrze przygotowane, aby skorzystać z tych trendów. Portfolio projektów Grupy jest wysoce rentowne i w dużej mierze oparte na najemcach. Roczna wartość inwestycji CTP utrzymała się na wiodącym w branży poziomie 10,31 TP5T. Kolejny etap rozwoju jest już wdrożony i finansowany – na dzień 30 czerwca 2025 r. w budowie znajduje się 2,0 mln m², a docelowo ma zostać oddanych od 1,2 do 1,7 mln m² w 2025 r.
Solidna struktura kapitałowa CTP, zdyscyplinowana polityka finansowa, silny dostęp do rynku kredytowego, wiodący w branży bank ziemi, wewnętrzne doświadczenie w budownictwie i głębokie relacje z najemcami pozwalają CTP realizować swoje cele. CTP spodziewa się osiągnąć 1,0 mld euro dochodu z wynajmu w 2027 r., napędzany ukończeniem inwestycji, indeksacją i rewersją, i jest na dobrej drodze do osiągnięcia 20 mln mkw. GLA i 1,2 mld euro dochodu z wynajmu przed końcem dekady.
Grupa ustaliła prognozę zysku na akcję skorygowanego według EPRA dla danej spółki na poziomie 0,86–0,88 EUR na rok 2025. Wynika to z naszego silnego wzrostu bazowego, wynoszącego około 415 tys. dolarów wzrostu w ujęciu porównywalnym, częściowo skompensowanego wyższym średnim kosztem zadłużenia z powodu (re)finansowania w latach 2024 i 2025.
Dywidenda
CTP ogłasza dywidendę zaliczkową w wysokości 0,31 euro na akcję zwykłą, co stanowi wzrost o 6,9% w porównaniu z dywidendą zaliczkową za 2024 r. i stanowi wypłatę 74% skorygowanego zysku na akcję EPRA Spółki, zgodnie z polityką dywidendową Grupy, wynoszącą 70% – 80%. Domyślnie dywidenda jest wypłacana w formie akcji, ale akcjonariusze mogą zdecydować się na wypłatę dywidendy w gotówce.
WEBCAST I TELEKONFERENCJA DLA ANALITYKÓW I INWESTORÓW
Dziś o godzinie 9 rano (GMT) i 10 rano (CET) Spółka przeprowadzi prezentację wideo i sesję pytań i odpowiedzi dla analityków i inwestorów, za pośrednictwem transmisji internetowej na żywo i połączenia konferencyjnego audio.
Aby obejrzeć transmisję na żywo, należy zarejestrować się na stronie:
https://www.investis-live.com/ctp/6863c5976c0d660016f95b35/kalwt
Aby dołączyć do prezentacji telefonicznie, należy wybrać jeden z poniższych numerów i wprowadzić kod dostępu uczestnika 893972.
Holandia +31 85 888 7233
Wielka Brytania +44 20 3936 2999
Stany Zjednoczone +1 646 664 1960
Naciśnij *1, aby zadać pytanie, *2, aby wycofać pytanie lub *0, aby uzyskać pomoc operatora.
Nagranie będzie dostępne na stronie internetowej CTP w ciągu 24 godzin od prezentacji: https://ctp.eu/investors/financial-results/
KALENDARZ FINANSOWY CTP
| Działanie | Data |
| Dni Rynku Kapitałowego (Wuppertal, Niemcy) | 24-25 września 2025 r. |
| Wyniki za III kwartał 2025 r. | 6 listopada 2025 |
| Wyniki za rok fiskalny 2025 | 26 lutego 2026 |
DANE KONTAKTOWE DLA ANALITYKÓW I INWESTORÓW:
Maarten Otte, Dyrektor ds. Relacji Inwestorskich i Rynków Kapitałowych
Telefon komórkowy: +420 730 197 500
E-mail: [email protected]
DANE KONTAKTOWE DLA MEDIÓW:
E-mail: [email protected]
O CTP
CTP jest największym w Europie notowanym na giełdzie właścicielem, deweloperem i zarządcą nieruchomości logistycznych i przemysłowych pod względem powierzchni najmu brutto, posiadając 13,5 miliona m² GLA w 10 krajach (stan na 30 czerwca 2025 r.). CTP certyfikuje wszystkie nowe budynki zgodnie z normą BREEAM na poziomie Very Good lub wyższym i uzyskał ocenę ESG znikomego ryzyka od Sustainalytics, co podkreśla zaangażowanie firmy w zrównoważony rozwój. Więcej informacji można znaleźć na stronie internetowej firmy CTP: www.ctp.eu
Zastrzeżenie
Niniejszy komunikat zawiera pewne stwierdzenia dotyczące przyszłości w odniesieniu do sytuacji finansowej, wyników działalności i działalności CTP. Te stwierdzenia dotyczące przyszłości można zidentyfikować poprzez użycie terminologii dotyczącej przyszłości, w tym terminów "uważa", "szacuje", "planuje", "projektuje", "przewiduje", "oczekuje", "zamierza", "cele", "może", "dąży", "prawdopodobnie", "byłby", "mógłby", "może mieć", "będzie" lub "powinien" lub, w każdym przypadku, ich negatywnych lub innych odmian lub porównywalnej terminologii. Stwierdzenia dotyczące przyszłości mogą i często różnią się istotnie od rzeczywistych wyników. W związku z tym nie należy przywiązywać nadmiernej wagi do jakichkolwiek stwierdzeń dotyczących przyszłości. Niniejsza informacja prasowa zawiera informacje poufne w rozumieniu art. 7 ust. 1 rozporządzenia (UE) nr 596/2014 z dnia 16 kwietnia 2014 r. (rozporządzenie w sprawie nadużyć na rynku).
[1] Dostosowane do mieszanki krajów.
[2] W przypadku połączenia lokalnego wskaźnika CPI oraz wskaźnika CPI w UE-27/strefie euro, tylko ograniczona liczba ograniczeń.
Zapisz się do naszego newslettera
Otrzymuj najświeższe informacje od lidera rynku nieruchomości przemysłowych prosto do swojej skrzynki odbiorczej.